Chapter 3 Writing reproducible research
3.1 Overview
Reproducibility refers to the ability of a researcher to duplicate the results of a prior study using the same materials as were used by the original researcher (Goodman, Fanelli, and Ioannidis 2016). This is a cornerstone of the sciences because if we cannot reproduce previous studies, we cannot rely on their results, and we cannot build on them to generate new knowledge. But what does R have to do with such a weighty topic? The answer is that because we interact with R by writing commands in a script file, which we can save, share and archive, we are doing our analysis in a way that can be reproduced. This can be contrasted with analysing data in Excel, SPSS, PAST and other mouse-driven software where many of the intermediate steps are typically mouse-clicks that leave no trace. Another person inspecting your Excel file may struggle to identify the decisions you made in your data anlysis because of the many ephemeral and unrecorded steps that led to the final result.
Why is reproducibility gaining attention? Four factors have lead to growing concerns about the reproducibility of scientific results in modern science. The first factor is reruns of landmark biomedical experiments that have failed to produce the same results as the initial publication of the experiment (Prinz, Schlange, and Asadullah 2011; Begley and Ellis 2012). The second factor is the discovery of high-profile studies where the published results were flawed due to simple errors data analysis(Baggerly and Coombes 2009; Herndon, Ash, and Pollin 2013). Third, there has been a sharp rise in the number of scholarly publications that have been retracted due to discoveries of misconduct such as fraudulent data and plagiarism (Van Noorden 2011; Steen 2013). Finally, there has been a growth of data-intensive research that use massive computer simulations or collect enourmous amounts of data from vast numbers of sensors (ie. astronomy and oceanography). These events have stimulated extensive discussion in many disciplines about how to improve the reproducibility of scientific research. Some of this discussion has resulted in calls from diverse dsicplines (Nosek et al. 2015) for publications to be accompanied by both the raw data that generated the figures in the paper (Reichman, Jones, and Schildhauer 2011), and the programming code that shows the steps taken in the data analysis (Barnes 2010; Ince, Hatton, and Graham-Cumming 2012; Morin et al. 2012). Related to these calls are a manifesto-like journal articles by groups of researchers that call for substantial changes in the research workflow to improve reproducibilty and transparency (Wilson et al. 2014; Hampton et al. 2015; Sandve 2013). I have explored these principles in more detail in Marwick (2016).
In this chapter I show how archaeologists can respond to these calls for increased reproducibilty and transparency. I describe two key principles: literate programming for enabling reproducibilty, and version control for enhancing transparency. Literate programming refers to the use of a computing environment for authoring documents that contain a mix of natural (eg. English) and computer (eg. R) languages (Schulte et al. 2012). Conveniently, R and RStudio are well-equipped to support literate programming, so this practice is relatively easy to learn. The second section of this chapter introduces version control using Git as a principle and tool for enhancing transparency and collaboration. Version control of literate programming files allows you to keep track of all the changes that you and your co-authors make to your files. Using the Git software for version control, you and your collaborators can safely create multiple different versions of your files to experiment with, and either abandon the results, merge them with the main versions, or revert to an earlier version. Athough, neither of these are strictly part of R, R integrates very well with other tools that enable these principles. This makes R unique as an environment for working reproducibly with minimal effort.
3.2 What does it mean to do reproducible research?
Before showing how we can make our research more reproucible, we should explore exactly what we mean by ‘reproducible’ because it is not widely used in archaeology. There is variation surrounding the use of the term ‘reproducibility’ in biology and computer science, especially in comparison to closely related terms such as replicability and reliability (Baker 2016). Here we follow Stodden’s [(2014); Stodden2016] defintion and taxnonomy of reproducibility, dividing the concept into three parts: empirical, computational, and statistical.
The first part is empirical reproducibility, also called ‘replicability’. For an archaeologist, this means evaluating a previously obtained result by re-excavating a site that another researcher had previously excavated, studying a museum collection that had previously been analysed by another person, or repeating an experiement that has been previously published. Empirical reproducibility is about returning to the source of the data and physically collecting the data again. Archaeologists do this routinely, for example, we return to famous sites such as Star Carr, Catal Huyuk, and Niah Cave to excavate them again. Usually this happens decades after the original excavation that make the site prominent. This is not exact empirical reproducibility, because we do not use the exact procedures of the previous workers, but instead use modern field methods to extract more data from the site, and improve upon and extend the earlier work. But the general idea of testing the previous claims about the site is usually the key motivation for returning to it.
The second and third parts of ‘reproducibility’ are computational and statistical reproducibility. Computational reproducibility refers to redoing the calculations of another researcher’s quantitative results using their original datasets and methods (i.e. code). This type of reproducibility does not involve independent data collection, but instead uses the methods and data collected by the original investigator. Enhancing computational reproducibility includes preseving the steps of how raw data are cleaned, tidied, and combined or separated in preparation for anlaysis and visualisation. Statistical reproducibility is enhanced when detailed information is provided about the choice of statistical tests, model parameters, threshold values, and other details that determine the outcomes of statistical analyses.
Computational and statistical reproducibilty are less familiar to most archaeologists, because our disciplinary culture tends to value secrecy and privacy, rather than sharing and openness of the mundane details of our analyses. Many archaeologists view the production of a research publication like the writing of a novel. The creative processes and drafting of the novel is typically a personal, private process that the author keeps to themself. Similarly, the readers of the novel generally have no expectation to see these drafts or have any exposure to the creative process. The author and the reader have a shared understanding that the published novel is the final product, and no other materials from the creative process (e.g. earlier drafts, notes, outlines) are needed to make sense of it. This is because the novel is primarily an aesthetic product, its value coming from how it arouses the emotions of the reader. Early drafts of the novel are typically irrelevant to the aesthetic value of the final published novel. Of course there are exceptions, for example we often enjoy to hear the author of a novel speak about their inspirations and motives in interviews, and literary scholars find value in the notes and paraphenalia of writers. For the most part, however, these details are not part of the unspoken contract between the fiction writer and their readers
Archaeological research, like other sciences, is fundamentally different from novel-writing, although traditional scholarly norms of not sharing anything except the final published article tend to reinforce the novel-writing model. The value of an archaeological publication is primarily not aesthetic, but in the truth-values of the claims made about human behvaiour in the past. In order to make a robust assessment of these claims, the reader may need to know details of the analytical process that are not presented in the final publication. There are many reasons why relavant details might not be inlcuded in a publcation. Primarily, we cannot anticipate and address every potential question in the limited space of a typical journal article. These kinds of private correspondences between readers and authors are common, and imply an interesting defintion of what data are in a research context. The implication is that that we as authors don’t have the final say on what data and method details are necessary to make our case. Whatever our readers (e.g. peer reviewers, other scholars) demand is what counts as the necessary data and methods details. This scholarly author-reader relationship is very different from the novel author-reader relationship. In our case, by making publiclly available our data and our code at the point of publication of our articles, we make it a lot easier for our readers to find the materials they need to evaluate our claims and resuse our work. Many fields are shifting their scholarly practices in recognition of this special relationship between author and reader. A full account is beyond the scope of this chapter, but betailed desriptions of these new ways of doing science are available for Oceanography (Lowndes et al. 2017) and soil science (Bond-Lamberty, Smith, and Bailey 2016).
Returning to the question of computational reprodubility, my view is one of the most pressing problems is that our research publications rarely include enough of the data to enable exact reanalysis, and our methods are rarely presented in enough detail to allow another person to independantly repeat our analysis unabimguously. This type of reproducibility is becoming an important issue for recent archaeological research due to advances in technology and the rapid spread of computational methods for many kinds of basic archaeological analysis. This can make it difficult to trust published research, and difficult for others to use newly published research in their own work. The short answer to improving computational and statistical reproducibility in archaeology is for archaeologists to include data files and programming code with their publications. These extra documents will allow another researcher to see all the steps from when the raw data entered the researcher’s computer to the end point where these data were summarised and visualised in a journal article. Literate programming methods are an efficient solution to this problem of combining code with the narratice text of publcations and reports.
3.3 Literate programming
The general principle of literate programming is to write code and text in one document so that a human reader can easily understand the purpose of the code (Knuth 1992). The original context of literate programming was to have a system for writing code so that text can be included among the code to explain the algorithms and data structures to other human readers. The concept of literate programming has evolved over time, and taken on a slightly different meaning within the R community, which might be more accurately called ‘literate computing’, ‘literate statistical programming’, ‘literate data analysis’, or ‘literate statistical practice’ (Schulte et al. 2012; Rossini, Lumley, and Leisch 2003; Koenker and Zeileis 2009; Gentleman and Temple Lang 2007; Hoefling and Rossini 2014). These new terms reflects a shift in the focus of literate programming from what was originally writing computer programs with some annotations for human users, to writing research reports that contain programming code to do data anlaysis and visualisation. Although the terminology is varied, the essence of the concept is that programing code is embedded or interleaved with the narrative text in the same document.
Writing research documents using a literate programming method improves reproducibility because a reader can see the details of the analytical methods used to compute the statistics, tables and plots of the publication or report. We do not need to copy and paste results from one program to another, because the code produces the results in situ each time the document is rendered. This elimintes errors from copy-pasting into a Microsoft Word document, where we have the risk that we might accidently skip some parts of the text that need updating. This approach also improves efficiency because we have the code and text in one place, greatly simplifying the organisation of our files. This makes it easier for us to navigate our project directories, and makes it easier to share files with collaborators and other people because they can more quicky find their way around.
Using R we have several options for doing literate programming. The one I recommend is centred on Yihui Xie’s knitr package (plus several others) and the markdown plain text format. It is easy to learn, very well supported with extensive documentation (Xie 2015), and enables all the usual scholarly writing requirements, such as captioning and cross-references figures and tables, citations and complex notation. The file format we use for this is called R Markdown, which is a plain text file that has the .Rmd suffx. We write text and code in the Rmd file using a text editor (such as RStudio), and ‘render’ or ‘knit’ that Rmd into an output format such as Microsoft Word, HTML or PDF. The rendered version contains the formatted text, citations, tables, figures, etc., and is suitable for submission to a journal, or circulation to colleagues. When writing an Rmd file, you typically have three key components: (1) the document metadata (usually a section at the top of the document), (2) the narrative text (the text of your article or report), and (3) the code blocks (sections of R code in between paragraphs of narrative text that generate plots, tables and other output to appear in the rendered document).
3.3.1 Document metadata, citations and the bibliography
The metadata section is defined by three dashes at the top and bottom of the section. In this section, we can indicate the title, author, date and many other details of the document. Crucially we can also specify what type of document to render the Rmd into, e.g. Microsoft Word document, PDF or HTML file. The metadata contains instructions for document-level details such as whether or not to include a table of contents, what style to use for the citations and reference list, and what template should be used to style the rendered document (e.g. to add line numbers). Here is an example of the metadata section from the Rmd file of one of my publications:
---
title: 'Movement of lithics by trampling: An experiment in the Madjedbebe sediments, northern Australia'
author:
- Ben Marwick
- Elspeth Hayes
- Chris Clarkson
- Richard Fullagar
date: '2019-05-28'
output:
   bookdown::word_document2:
    fig_caption: yes
    reference_docx: templates/template.docx
bibliography: trampling.bib
csl: journal-of-archaeological-science.csl
abstract: |
  Understanding post-depositional movement of artefacts is vital to making reliable claims about the formation of archaeological deposits. Human trampling has long been recognised as a contributor to post-depositional artefact displacement. We investigate the degree to which artefact form (shape-and-size) attributes can predict how an artefact is moved by trampling. We use the Zingg classification system to describe artefact form. Our trampling substrate is the recently excavated archaeological deposits from Madjedbebe, northern Australia. Madjedbebe is an important site because it contains early evidence of human activity in Australia. The age of artefacts at Madjedbebe is contentious because of the possibility of artefacts moving due to trampling. We trampled artefacts in Madjedbebe sediments and measured their displacement, as well as modelling the movement of artefacts by computer simulation. Artefact elongation is a significant predictor of horizontal distance moved by trampling, and length, width, thickness and volume are significant predictors of the vertical distance. The explanatory power of these artefact variables is small, indicating that many other factors are also important in determining how an artefact moves during trampling. Our experiment indicates that trampling has not contributed to extensive downward displacement of artefacts at Madjedbebe.
keywords: |
  Trampling; Artifact movement; Experimental archaeology; Australia; Simulation
---
The language of this metadata is not R, but a format called YAML, and is distinctive with its key: value patterns. This example shows just a few of the possible metadata fields. The title, author and abstract fields are straightforward, but you can see that the date field has some R code that will insert the current date when the document is rendered. This means that the outputted docx file will automatically have the date of the latest change, and I don’t have to worry about updating it by hand. The output: field shows that I have used the word_document2() function from the bookdown package to render this Rmd into a Microsoft Word document. This word_document2() function is important for writing scholarly documents with R Markdown because it provides the automatic numbering and cross-referencing of figures and tables in the document. The bookdown package also contains related functions for writing a multi-part document such as a book or manual.
In the document metadata above I have also indicated that I want to show the figure captions in the output doucment with fig_caption: yes. The line reference_docx: templates/template.docx indicates that I am using a docx file called template.docx as custom template to add some styling to my output. In this specific case, the template.docx adds line numbers to the rendered docx file, specifies Times New Roman as the body text font, and a few other minor adjustments to meet the submission requirements of our target journal. The rticles package by RStudio provdes Rmd templates for manuscripts for several major scholarly publishers. A template for producing output that follows the APA style (American Psychological Association) can be found in the crsh/papaja package. Other templates are available in the the [Pakillo/rmdTemplates/])(https://github.com/Pakillo/rmdTemplates/) package. Many Rmd metadata fields are documented at http://rmarkdown.rstudio.com, and https://www.rstudio.org/links/r_markdown_reference_guide. I have also found many useful examples of Rmd metadata by browsing and searching github.com.
We can also see the file containing the bibliographical information specified at bibliography:, and a file that gives the in-text citation and reference list style at csl: (citation style language). R Markdown can handle bibliography files in a variety of formats, including RIS, EndNote’s .enl and BibTeX’s .bib. I typically use BibTex, and my .bib file is a plain text file that I create by copying and pasting the reference details from various sources, such as my reference manager library (e.g. EndNote, Mendeley, Zotero) or directly from Google Scholar. The .csl file is one I copied directly from a collection of journal citation styles (e.g. from http://citationstyles.org/). Here are the bibliographic details for one of the items in the .bib file for this book:
@article{Marwick2016JAMT,
year={2016},
issn={1072-5369},
journal={Journal of Archaeological Method and Theory},
doi={10.1007/s10816-015-9272-9},
title={Computational Reproducibility in Archaeological Research: Basic Principles and a Case Study of Their Implementation},
url={http://dx.doi.org/10.1007/s10816-015-9272-9},
publisher={Springer US},
keywords={Reproducible research; Computer programming; Software engineering; Australian archaeology; Open science},
author={Marwick, Ben},
pages={1-27},
language={English}
}
Most of the lines in the above example are easy to understand attributes of a bibliographic reference. Perhaps the most important detail is in the first line, Marwick2016JAMT, which is the key that we used to link the in-text citation to these bibliographic details. To include a citation of this paper in my R markdown file, I type [@Marwick2016JAMT], and this is rendered in the output document as a nicely formatted citation like this: (Marwick 2016). All of the usual variations of in-text citations are possible with this notation:
| Effect | Markdown notation | Result |
|---|---|---|
| Complex combinations of citations | ...some narrative text... [see @Marwick2016JAMT, pp. 13-15; also @knuth1992literate, ch. 1]. |
…some narrative text… (see Marwick 2016, 13–15; also Knuth 1992, ch. 1). |
| Page ranges | ...some narrative text... [@Marwick2016JAMT, pp. 13-15, 18-19 and elsewhere]. |
…some narrative text… (Marwick 2016, 13–15, 18–19 and elsewhere). |
| Multiple citations | ...some narrative text... [@Marwick2016JAMT; @knuth1992literate]. |
…some narrative text… (Marwick 2016; Knuth 1992). |
| Date-only citation | Marwick says you should use a scripting language for your analysis [-@Marwick2016JAMT]. |
Marwick says you should use a scripting language for your analysis (2016) |
| Use author’s name in text | @Marwick2016JAMT says you should use a scripting language for your analysis. |
Marwick (2016) says you should use a scripting language for your analysis. |
| Use author’s name and page number | @Marwick2016JAMT [p. 13] ays you should use a scripting language for your analysis. |
Marwick (2016, 13) says you should use a scripting language for your analysis |
| Multiple cites by same author | many good examples by Marwick et al. [-@MarwickVanVlack; -@MarwickJerimalai] |
many good examples by Marwick et al. (2017, 2016) |
When the Rmd document is rendered, these citations appear in the output document with proper styling and the reference list is automatically generated and added to the end of the document. The styleing of the citations and reference list is controlled by the .csl file, it could be author-date, as above, or numbered citations, etc.
Typically, directly after this block of metadata we have a block of code that contains all the library() functions to enable all the functions that we use from contributed packages. This is a useful convention because it helps other readers quickly see what packages are required to perform the analysis in your report. In this book I have taken a different approach and show the library calls much more often than strictly necessary to help you make associations between libraries and the functions they contain.
3.3.2 Narrative text, structuring the document and special characters in the text
Narrative text refers to the body text of your document, such as this paragraph you’re currently reading. Most archaeologists are accustomed to writing in a word processor such as Miscroft Word, where can change the appearance of the document while we write, for example by adding bold formatting and changing the size of the font. When we use Microsoft Word, we are using a “what you see is what you get” editor – we edit a document in a form resembling the final printed or presented document. Writing an R Markdown document is a different experience because we writing in plain text, and we include instructions in the document that only apply formatting during the process of rendering to generate the output. This means that while we are writing an R Markdown document we do not see bold text or text in difference sizes. This is a very typical writing experience for many researchers in the natural and physical sciences, where the LaTeX document preparation system is popular for writing journal articles (Brischoux and Legagneux 2009). LaTeX is a widely used code-based document preparation system, with particular strengths in complex formatting needed by technical scientific documents. Although highly flexible, LaTeX is also complex and verbose, requiring a lot of typing to add the formatting code to your document. LaTeX requires a basic working knowledge of computer programming, so non-programming researchers seldom use it. This method of creating documents is preferred in disciplines such as mathematics and physics, where complex equations are written using code, because for many people it is easier to write code to produce equations than use a mouse to click on menus and buttons to select the special characters needed for equations. Markdown is closely related to LaTeX, but much simpler system for preparing documents. Markdown does not require any programming skills to use, so it is well-suited for researchers in the social sciences. The advantage of Markdown over LaTeX is that the document is much less cluttered with formatting code for typical writing, but LaTeX can be used where more complex symbols, expressions or formatting are necessary.
There are several reasons why a plain text document preparation system might be prefereble over a word processor. The most compelling one is that we cannot interweave exectutible R code in a word processor document. Of course we can add R code to a word processor document, but there is no way to run the code in that document to update the document. We must copy and paste updated results into the word processor document. With a plain text format such as R Markdown, we can include R code, and have that code generate output to update the figures, tables and other results in the document. This is the most important charactersting of R Markdown that makes our documents more reproducbile. Finally, plain text files are able to take advantage of the git version control system for collaboration. This system allow fine-grained control of the history of changes to a plain text document, more on this below in the Version Control section below.
Some other reasons to use a plain text format that are important to me include portability, compactness, security and collaboration (Cottrell 1999). Portability means that when we use a plain text system such as R Markdown, anybody, using any computer platform, will be able to read our text, even if they don’t have the means to view or print the rendered version. With plain text, the accessibiltiy of the contents of our document is not restricted to a certain program, or a specific operating system, which might become increasly hard to find working copies of in the future. This guarantee of long-term accessibility should have a special appeal to archaeologists who are more senstive than most researchers to the decadal pace of technological change. Compactness refers to the size of the file, often plain text files requires orders of magnitude less disk space that corresponding word processor files. This means plain text files are more quicker and more responsive to work with, and easier to circulate and store. Security is about the risk of losing your document to software crashes or file corruption. With a plain text document we have much less that can go wrong in the normal course of preparing the document.
Choosing software to write plain text documents can be challenging because of the wide variety of options. I recommend RStudio because it contains comprensive support for writing R Markdown, saving time and effort. For example, RStudio will highlight markdown text and R code in a way that makes it more readable. It will automatically indent or tidy up your code as you write it. It will also passively signal to you when you’ve done something wrong in your code (such as forget a closing bracket, semicolon or quotation mark). RStudio also comes with Pandoc built-in, which is the software that helps with converting between Markdown and Micrsoft Word, PDF and HTML. Having Pandoc built-in to RStudio saves you from working with Pandoc outside of RStudio in a terminal.
Other popular editors for writing R Markdown documents include Sublime Text (for OSX only), Notepad++ (for Windows only), Atom (cross-platorm) and Emacs (also cross-platorm). These other editors are ideal if you enjoy spening time configuring and customising your writing environment. If your priority is writing text and code, or you are collaborationg with authors who don’t enjoy spening time configuring and customising, then RStudio is a good choice. The RStudio text editor, like the others, do not include any tools for formatting your text in situ, for example you cannot make words appear in the editor with bold or italic characters. This is a deliberate design, and is typical among text editing programs used for writing code and Markdown. When working with a plain text editor, we type unformatted plain text and code, and among the text we include instructions on how the final document should appear. For example if we want a word to appear in italics, we would type in our R Markdown document it like *this*. In this example, when we convert our R Markdown document into a final version, such as a PDF, the two asterix symbols will be interpreted by Pandoc to produce a document with this word in italics. Headings and subheadings are indicated by # symbols, the top level heading has a single # directly preceeding the header text, and second and third level headings have ## and ###, and so on, like so:
# This is my top-level heading, such as 'Introduction'

## This is my second-level heading, suitable for a sub-heading

### This is my third-level heading, i.e. a sub-sub-heading. Probably we don't want to many levels of heading below this one because it may overwhelm our reader.
Typically in writing for research we need to include special symbols that are not part of the common character set. The following table shows how to generate commonly used symbols in a R Markdown document, the notation surrounded by dollar signs $ is LaTeX notation:
| Symbol | Markdown/LaTeX notation |
|---|---|
| per mille ‰ | $\text{\textperthousand}$ |
| delta δ | $\delta$ |
| plus-minus ± | $\pm$ |
| degree ° | $\text{\textdegree}$ |
| subscript CO2 | CO~2~ |
| superscript 14C | ^14^C |
With LaTeX it is possible to include a great range of mathematical symbols into your text. There are numerous online sources to look up the notation for a specific symbol or expression, e.g. https://en.wikibooks.org/wiki/LaTeX/Mathematics
3.3.3 Code blocks
In an R Mardowm document code blocks (also known as chunks) are demarcated by three backticks, followed by curly brackets indicating the programming language of the code. Here is a very simple code block that demonstrates how the backticks are used:
```{r}
1 + 1
```
If this block was in our document, the output would look like this:
1 + 1## [1] 2Often in writing for research we don’t want all the code blocks to be visible in the rendered output because they disrupt the reader’s experience with the contents of the document (and journal editors don’t like to see code blocks in submitted manuscripts). We can stop the code blocks from appearing in the rendered output in two ways. First is an option we can set for each block in the document, in case we case to show some blocks and hide others in the rendered output. Second is a single setting we can make for the whole document that hides all the blocks. To hide one code block we can use the echo option in the block we want to hide, like this:
```{r echo = FALSE}
1 + 1
```
But to hide all the blocks, we add a new block at the top of our document, directly below our document metadata, to set document-wide options, like this:
```{r include = FALSE}
library(knitr)
opts_chunk$set(echo = FALSE)
```
Note that this example has both include =, and echo =. They are subtly different, include = FALSE will let the code run, but include neither the text of the code nor its output in the rendered document, while echo = FALSE hides the code but lets the output appear (such as a plot). There are a large number of options for controlling the behaviour of code blocks in R Markdown documents. These are documented at https://yihui.name/knitr/options/, Xie (2015) and Gandrud (2015). I typically use these options to configure how the code blocks appear in my rendered documents:
library(knitr)
opts_chunk$set(echo = FALSE,
               warning = FALSE,
               message = FALSE,
               dpi = 900,
               fig.align = 'center')

# image width should be 90 mm for 1 col, 140 mm for 1.5 col, 190mm for two cols
fig_width_two_col <- 190/25 # inches
fig_width_one_col <- 90/25 # inches
In addition to hiding all the code blocks with echo = FALSE, the warning = and message = options prevent these types of messages from appearing with my output. This means that if I have a code block that generates a plot, but might also produce a warning, I will not see that that warning in my rendered output. I will still see the warnings and messages while I am developing the code interactively in the console, and they will be printed in the console when the document is rendered. The dpi = option ensures that the resolution of the plots that are created by the code blocks are suitably high, and fig.align = centre-aligns my figures. The two lines at the bottom of that code block create objects that store a value that I use in other code blocks to set the width of the plot or figure that a code block produces, more on that below. Thre are many other possible options that can be set at this point, to see the full list, run ?opts_chunk in your R console, and see https://yihui.name/knitr/options/#chunk_options for a description of what they do.
3.3.3.1 Saving time with blocks of long-running code
If you have a block of code in your document that takes some time to run (e.g. more than 5 minutes), there are several options to avoid having to run that code every time you render the document. One simple method is to using caching for the code block, so that when the code block is first run, the results will be stored. These stored results will be each time the document is rendered, saving time waiting for the code to run again. The cached results will be reused until the code in that code block is changed. After the code in that block is changed, the code will be re-run then next tim that the document is rendered. Here’s an exampe of a code block that uses caching:
```{r code-block-A, echo = FALSE, cache = TRUE}
z <- rnorm(10) # generate ten random numbers
```
Because we set cache = TRUE, the object z will be stored and reused each time we render the document, until we make a change to the code in this block. Sometimes we might have a mix of cached and unchached code blocks, and some of the cached code blocks depend on each other. For example, suppose we have code block A (cf. the code block above) that performs a long-running computation, and later in our document we have code block B that uses the result of A to perform a second, different long-running computation. We would use cache = TRUE for both code block A and B to store the results so we don’t have to wait while we work on other parts of the document. But we also need to indicate that if there is a change to the code in code block A, but no change in the code in code block B, then the code in code block B still needs to be re-run to incorporate the update in code block A. We can manage this dependency between these two code blocks by adding dependson = to code block B, for example:
```{r code-block-B, echo = FALSE, cache = TRUE, dependson = 'code-block-A'}
mean(z)
```
We can also use dependson = to reference multiple code blocks, for example dependson = c('code-block-A', 'code-block-C'). The use of dependson = in code block in an R Markdown document ensures that when other code blocks are changed, this block will be updated accordingly. Caching can increase the complexity of a document substantially, and I generally use it sparingly. Further readering on the details of caching in R Markdown can be found at https://yihui.name/knitr/demo/cache/.
A second strategy for saving time with long-running code is to explicitly save the output on the first run, and then re-use that output by loading it in later code blocks. A typical use-case for this method is when a computation takes days or weeks, for example, on a high-perfomance computing facility, and you want to save the output in a portable format and reuse it in different documents. In this case you might save the output as a plain text open format file (such as CSV or XML) and load them with a read_xxx function (more on these in Chapter X). Or you might save the output of the long-running computation as an RData object using save() (ideal for when you want to save many objects) or save as a rds object using saveRDS() (ideal from when you want to save a single object, such as the object z in the code block above). Although plain text open file formats are better for long-term presernation of data, an RData object might be preferable if the structure of the output data if difficult to represent in a flat table (for example, a deeply nested list). To use a saved data object we can include in a code block load() for RData files, and readRDS() for rds files.
3.3.4 Cross-referencing and captioning figures
Another important option for managing code blocks in an R Markdown document is labelling them. Labelling is useful for two reasons, firstly for efficiently navigating through many blocks in a document, and secondly to enable cross-referencing of tables and figures. Here’s an example of a code block with a label:
```{r simple-addition, echo = FALSE}
1 + 1
```
In this example the label is ‘simple-addition’, and this is the key to make cross-references work in R Markdown. Code block labels do have a few constraints, they can only contain alphanumeric characters (a-z, A-Z, 0-9), slashes (/), or dashes (-). Underscores are not allowed in code block labels, and code block labels must be unique, you cannot have two blocks with the same label. We use the labels to link in-text cross-reference to the output of the code block with that label. The general form of cross-referencing is to type \@ref(fig:label) where label is the code block label that you are referring to. If you are referring to a code block that produces a table (by using knitr::kable()), then the general form is \@ref(tab:label). In addition to a code block label, a second element is required to enable cross-referencing. This is a caption, which we can add using the fig.cap option in the first line of the code block. For example, this code block produces a simple plot, and is labelled ‘simple-plot’, and we have set the caption as ‘This is a simple plot’ :
```{r simple-plot, echo = FALSE, fig.cap = "This is a simple plot."}
plot(1:10)
```plot(1:10)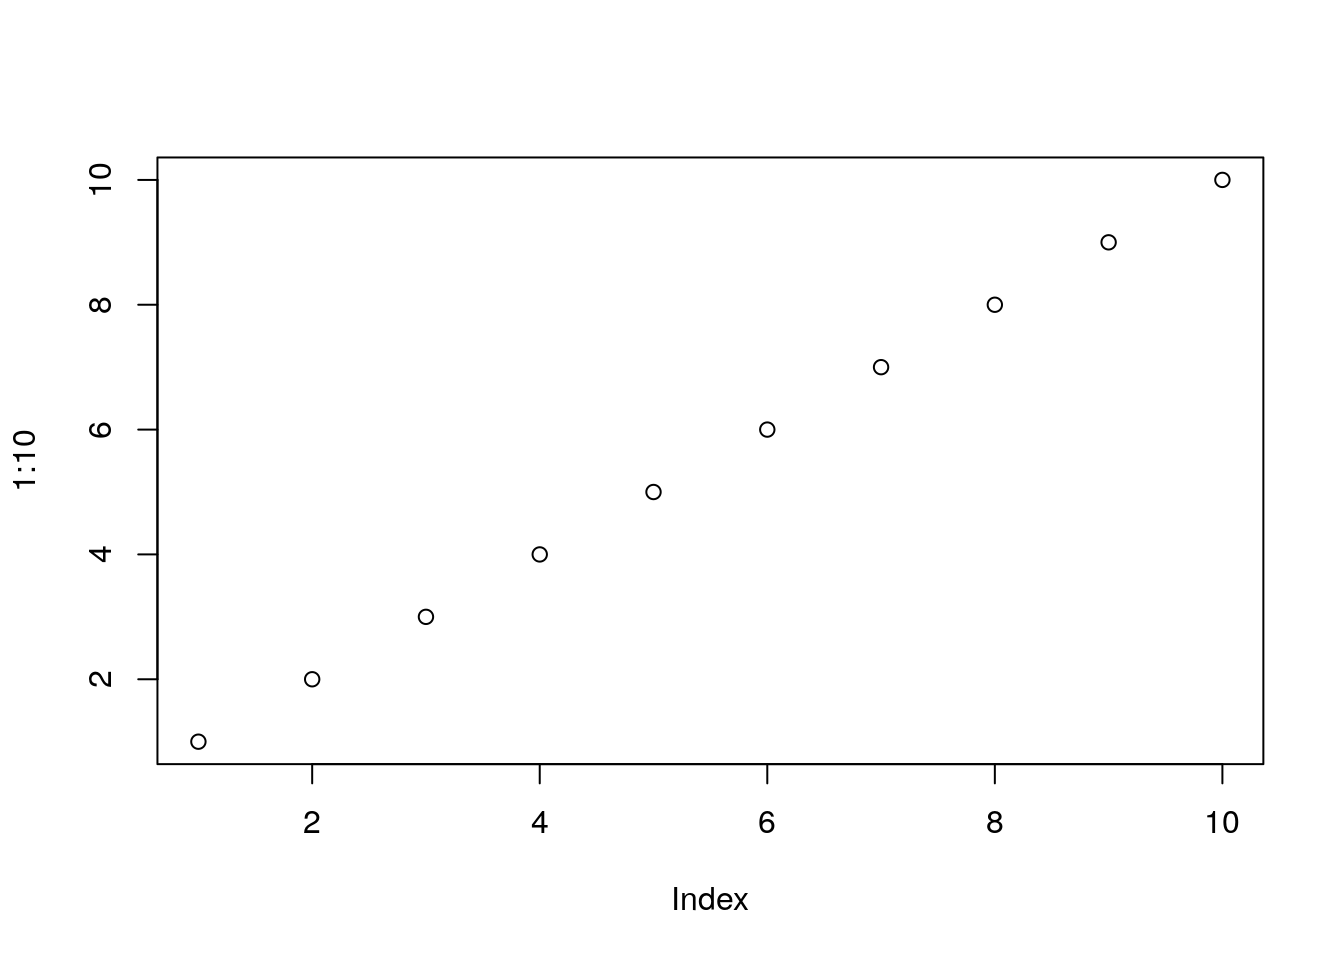
Figure 3.1: This is a simple plot.
When we want to refer to that plot in our text, we type \@ref(fig:simple-plot) and this will be rendered into the figure number that this plot has in our document, for example, Figure 3.1. Occasionally we need to include a cross-reference within the caption of a table or figure. To make this work need to add one backslash, like this \\@ref(fig:simple-plot). The second backslash ‘escapes’ or hides the other backslash from being interpreted by R. This is necessary because the backslash is one of a small set of special characters, or metacharacters that have specific meaning in R that is different from how we use them in English writing. The others metacharacters are: $ * + ? ^ { } | ( ) and the period at the end of this sentence. The special properties of these metacharacters are very useful for cleaning and manipulating data, we’ll discuss this more in Chapter XX.
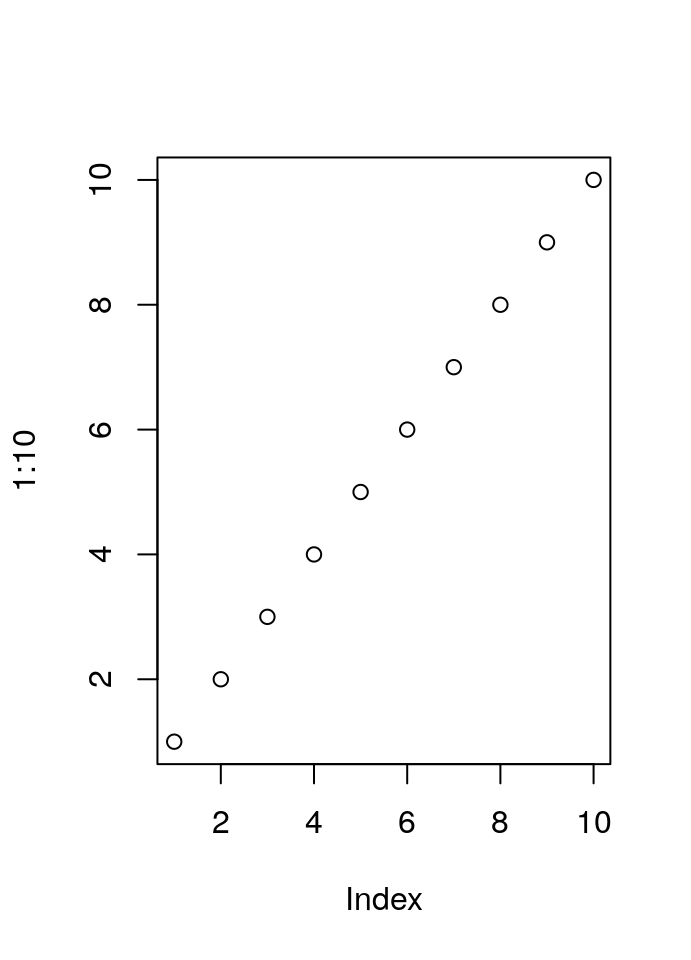
Relating to figures, another code block option that I use often is fig.width. When writing a manuscript for submission to a journal, I will check the journal’s instructions to authors for information about figure sizes. Often they specify a width in millimeters for images that span one or two columns. You can see in one of the above code blocks I created an object called fig_width_one_col, this just holds a single numeric value for the width of a figure (in inches) in order to span two columns in one of the archaeology journals that I have published in. This saves me time so I don’t have to adjust the width of each figure indvidually. In this example we can see three important functions: 1) how to set the width of the plot using fig.width =, 2) how to cross-reference another figure elswhere in the document with \\@ref, and 3) how to use a citation in a caption (just like we would in a paragraph of narrative text:
```{r simple-plot-one-col-wide, echo = TRUE, fig.cap = "A simple plot. This plot is one column wide, unlike Figure `` `\\@ref(fig:simple-plot)` `` which is wider. A classic source of information for plotting in R is @murrell2016Rgraphics.", fig.width = fig_width_one_col}
plot(1:10)
```
3.3.5 Cross-referencing captioning tables
Including tables in R Markdown is similarly straightforward. I typically use the kable() function from the knitr package, and occassionaly Hao Zhu’s kableExtra package for more elaborate tables. However, there are a many other packages for producing more complex and flexible tables. There is an informative table comparing some of the more widely used packages in the vignette of the huxtable package (https://cran.r-project.org/web/packages/huxtable/vignettes/design-principles.html). A detailed review of all the options for making tables is beyond the scope of this chapter, and we can simply note here that you can make any table design you want in R Markdown, with a little effort. Table 3.1 shows simple table that results from the kable() function from the knitr package:
| Rule | Details |
|---|---|
| O | Order rows and columns by size or some other meaningful measure |
| R | Round to two or three significant or effective digits. |
| A | Average or sum rows and columns to provide a visual focus |
| C | Columnize: put items to be compared in the same column, one above the other. |
| L | Lay out the table to facilitate comparisons, don’t insert too much white space: things to be compared should be close to each other, but add gaps every 5 or so rows to help the eye travel across the table. |
| E | Explain the patterns of the data and use descriptive titles |
Caption with ‘invalid multibyte string’: “The table summarises some simple and classic guidelines for presenting data in tables (Ehrenberg 1977; Feinberg and Wainer 2011; Wainer 1997). To make the guidelines more memorable, we can abbreviate them into the mnemonic ‘oracle’. These guidelines should not be followed blindly: tables are meant for communication, and you should rather ignore these guidelines than slavishly follow them and corrupt the message of your table.”
Notice that the method for adding a caption to a table is slightly different from captioning a figure. For a table, we add a caption with the caption = argument in the kable() function, rather than the fig.cap = option for the code block. However, the method for cross-referencing a table is similar to cross-referencing a figure, we type \@ref(tab:simple-table), which automatically gives us the table number when rendered: 3.1. Just like when referencing figures we use the code block label as the link. The only difference in the cross-reference syntax is tab: for tables instead of fig: for figures.
A key principle to keep in mind when preparing a table for a report or publication is that a table is for communication, not data storage. To store data for resuse you need to archive a digital file, saved in an open, plain text format (such as CSV), and deposit it in a well-known and trustworthy data repository, and include in your publication a persistant URL (such as a DOI) to the file. Tables interleaved amongst text are meant for human eyes and minds, not for machine ingest, so you should design them with this in mind to opitmise their effectiveness. In any cases a plot many be more effective that a table, see Gelman, Pasarica, and Dodhia (2002) for examples of plots can improve on tables.
3.3.6 Using inline R code to put results in the text
Often in writing for research we want to include some numeric output within our text, such as the output of some data analysis or a hypothesis test. For writers using Microsoft Word or similiar software, they will compute their result in another program, such as Microsoft Excel or SPSS, and then paste the results into their Word document. The problem with this method is keeping the Word document up to date during the many iternations that data anlyses often involve. There is a mental burden to keeping track of all the locations in a document where a value needs to be updated when a new analysis is completed. R Markdown provides a solution to the problem with in-line R code. When writing in R Markdown document, we can write R code in the middle of a sentence to compute a result, and when the document is rendered, the code is excecuted and numerical output appears in our rendered document in place of the R code. When typing in-line R code we demarcate it with a single backtick at the start and end, and the code is prefixed with the letter ‘r’ to indicate the programming language. Here is a simple example: in our R Markdown document we type `r 5 * 2` (as in ‘five times two’), and when we render that document we will see 10 in place of the R code.
When writing in-line R code it is good practice to keep the code short so that the code doesn’t interrupt the flow of the sentence for the reader (i.e. you, when you are writing the Rmd document, and your colleagues who are also editing that document). An easy way to keep the in-line code short is to use a code block for the more complex operations, and then assign the result that you want to show in the text to an object. You then use that object in the in-line R code to make the values appear in the rendered text. Here is a simple code block to demonstrate this approach:
# We add up all the numbers from 1 to 10
x <- sum(1:10)
And here is our narrative text that includes inline code to use the output from that code block in a sentence. The inline code is typed as: `r x`, and we can use the output like this: The sum of all the numbers from 1 to 10 is 55. This appoach is especially convienent for extracting a few values value from a large table or other data object, and rounding them so it is suitable to include in a sentence. A common use-case for this approach is when we do a statistical hypothesis test and want to report the test statistic and p-value in parentheses in of a sentence. More on this in Chapter XX.
For further reading on more details on figures, tables, cross-referencing and citation in R Markdown documents I recommend Xie (2016). For more details on customising code chunks, a good reference is Xie (2015).
3.3.7 Rendering the R Markdown into an output file
By far the simplest method to render, or convert, an R Markdown document into a Microsoft Word, HTML or PDF document is to click on the ‘Knit’ button at the top of the source editor window in RStudio. The Knit button will inspect the settings in our R Markdown document metadata, and render the output according to those specifications. It is of course also possible to use a function to render the document from the console. For example rmarkdown::render("my_document.Rmd") (i.e. the render function in the rmarkdown package) or knitr::knit("my_document.Rmd") (i.e. the knit function in the knitr package). These functions can take many options to control how the Rmd file is rendered, however, I generally avoid using them because they are bad for reproducibility. Because a document cannot render itself, we must use the knit or render functions outside of the document, and this means that some of the options for how the document is rendered might not be contained in the document. I prefer to have the rendering options self-contained in the Rmd document, and then either use the knit button, or a very simple function such as render("my_document.Rmd") with no additional arguments. This means that I will always have a record of the settings I need to render the my document because they are contained within the document itself, rather than as arguments to the render() function.
Generally I eschew mouse-driven actions in the course of data anlaysis, because they often leave no trace and are bad for reproducbility. The two major exceptions are rendering an R Markdown into an output document, where I recommend a mouse-click on the knit button in RStudio, and setting the working directory. For setting the working directory, I recommend using the RStudio toolbar and clicking on ‘Session’ -> ‘Set Working Directory’, and then usually the best option is to choose ‘To Source File Location’. However, when you become more familiar with complex file structures you may find the other options more useful. By excluding these two actions from the code in your R Markdown document you make your document more portable. This is because the full path of the working directory your computer is probably unique to that computer, and if another person attempts to use your code on their computer any function that uses your path will fail because your path does not exist on their computer. For rendering the document, it is important to keep the rendering options specified in the document metadata (i.e. the YAML front matter at the top of the Rmd file), rather than in a render() function call. This ensures that when another person attempts to render your document, then have all the information necessary about, for example, what .bib file to use for your citations and references.
3.4 Summary
In this chapter I described a key principles of reproducible research, literate programming. This is dervied from computer science research and has been adopted by other disciplines, such as ecology and political science, to enable computational and statistical reproducibility. I also demonstrate the current software tools (R Markdown and knitr) that allow us to put this principle into practice. Over time, these software tools will change, and perhaps be replaced by something completely different. However, the principles that they are based on will endure, and are worth becoming familiar with as key concepts in computational and statistical reproducibility.
References
Baggerly, Keith A, and Kevin R Coombes. 2009. “Deriving Chemosensitivity from Cell Lines: Forensic Bioinformatics and Reproducible Research in High-Throughput Biology.” The Annals of Applied Statistics. JSTOR, 1309–34.
Baker, Monya. 2016. “Muddled Meanings Hamper Efforts to Fix Reproducibility Crisis.” Nature News. https://doi.org/10.1038/nature.2016.20076.
Barnes, Nick. 2010. “Publish Your Computer Code: It Is Good Enough.” Nature 467 (7317). Nature Publishing Group: 753–53.
Begley, C. Glenn, and Lee M. Ellis. 2012. “Drug Development: Raise Standards for Preclinical Cancer Research.” Nature 483 (7391): 531–33. https://doi.org/10.1038/483531a.
Bond-Lamberty, Ben, A Peyton Smith, and Vanessa Bailey. 2016. “Running an Open Experiment: Transparency and Reproducibility in Soil and Ecosystem Science.” Environmental Research Letters 11 (8). IOP Publishing: 084004.
Brischoux, François, and Pierre Legagneux. 2009. “Don’t Format Manuscripts: Journals Should Use a Generic Submission Format Until Papers Are Accepted.” The Scientist 23 (7): 24.
Cottrell, Allin. 1999. “Word Processors: Stupid and Inefficient.” Essay, http://www.ecn.wfu.edu/cottrell/wp.html.
Ehrenberg, ASC. 1977. “Rudiments of Numeracy.” Journal of the Royal Statistical Society. Series A (General). JSTOR, 277–97.
Feinberg, Richard A, and Howard Wainer. 2011. “Extracting Sunbeams from Cucumbers.” Journal of Computational and Graphical Statistics 20 (4). Taylor & Francis: 793–810.
Gandrud, Christopher. 2015. Reproducible Research with R and R Studio, Second Edition. 2nd ed. Chapman and Hall Crc the R Series. Chapman; Hall CRC. http://gen.lib.rus.ec/book/index.php?md5=89E3848976A5DFAC000A892AA29FFE8D.
Gelman, Andrew, Cristian Pasarica, and Rahul Dodhia. 2002. “Let’s Practice What We Preach: Turning Tables into Graphs.” The American Statistician 56 (2). Taylor & Francis: 121–30.
Gentleman, Robert, and Duncan Temple Lang. 2007. “Statistical Analyses and Reproducible Research.” Journal of Computational and Graphical Statistics 16 (1). Taylor & Francis: 1–23.
Goodman, Steven N., Daniele Fanelli, and John P. A. Ioannidis. 2016. “What Does Research Reproducibility Mean?” Science Translational Medicine 8 (341). American Association for the Advancement of Science: 341ps12–341ps12. https://doi.org/10.1126/scitranslmed.aaf5027.
Hampton, Stephanie E., Sean S. Anderson, Sarah C. Bagby, Corinna Gries, Xueying Han, Edmund M. Hart, Matthew B. Jones, et al. 2015. “The Tao of Open Science for Ecology.” Ecosphere 6 (7): art120.
Herndon, Thomas, Michael Ash, and Robert Pollin. 2013. “Does High Public Debt Consistently Stifle Economic Growth? A Critique of Reinhart and Rogoff.” Cambridge Journal of Economics. https://doi.org/10.1093/cje/bet075.
Hoefling, Holger, and Anthony Rossini. 2014. “Reproducible Research for Large-Scale Data Analysis.” In Implementing Reproducible Research, edited by Victoria Stodden, Friedrich Leisch, and Roger D Peng, 1–17. CRC Press.
Ince, Darrel C., Leslie Hatton, and John Graham-Cumming. 2012. “The Case for Open Computer Programs.” Nature 482 (7386): 485–88.
Knuth, Donald E. 1992. “Literate Programming.” CSLI Lecture Notes, Stanford, CA: Center for the Study of Language and Information (CSLI), 1992 1.
Koenker, Roger, and Achim Zeileis. 2009. “On Reproducible Econometric Research.” Journal of Applied Econometrics 24 (5). Wiley Online Library: 833–47.
Lowndes, Julia S Stewart, Benjamin D Best, Courtney Scarborough, Jamie C Afflerbach, Melanie R Frazier, Casey C O’Hara, Ning Jiang, and Benjamin S Halpern. 2017. “Our Path to Better Science in Less Time Using Open Data Science Tools.” Nature Ecology & Evolution 1. Nature Publishing Group: 0160.
Marwick, Ben. 2016. “Computational Reproducibility in Archaeological Research: Basic Principles and a Case Study of Their Implementation.” Journal of Archaeological Method and Theory. Springer US, 1–27. https://doi.org/10.1007/s10816-015-9272-9.
Marwick, Ben, Chris Clarkson, Sue O’Connor, and Sophie Collins. 2016. “Early Modern Human Lithic Technology from Jerimalai, East Timor.” Journal Article. Journal of Human Evolution 101: 45–64.
Marwick, Ben, Hannah G. Van Vlack, Cyler Conrad, Rasmi Shoocongdej, Cholawit Thongcharoenchaikit, and Seungki Kwak. 2017. “Adaptations to Sea Level Change and Transitions to Agriculture at Khao Toh Chong Rockshelter, Peninsular Thailand.” Journal Article. Journal of Archaeological Science 77: 94–108. https://doi.org/10.1016/j.jas.2016.10.010.
Morin, A., J. Urban, P. D. Adams, I. Foster, A. Sali, D. Baker, and P. Sliz. 2012. “Shining Light into Black Boxes.” Science 336 (6078): 159–60. https://doi.org/10.1126/science.1218263.
Murrell, Paul. 2016. R Graphics. CRC Press.
Nosek, B. A., G. Alter, G. C. Banks, D. Borsboom, S. D. Bowman, S. J. Breckler, S. Buck, et al. 2015. “Promoting an Open Research Culture: Author Guidelines for Journals Could Help to Promote Transparency, Openness, and Reproducibility.” Science (New York, N.Y.) 348 (6242): 1422–5.
Prinz, Florian, Thomas Schlange, and Khusru Asadullah. 2011. “Believe It or Not: How Much Can We Rely on Published Data on Potential Drug Targets?” Nat Rev Drug Discov 10 (9): 712–12. https://doi.org/10.1038/nrd3439-c1.
Reichman, OJ, Matthew B Jones, and Mark P Schildhauer. 2011. “Challenges and Opportunities of Open Data in Ecology.” Science 331 (6018).
Rossini, AJ, Thomas Lumley, and Friedrich Leisch. 2003. “On the Edge: Statistics & Computing: Reproducible Statistical Research.” Chance 16 (2). Taylor & Francis Group: 41–45.
Sandve, Anton AND Taylor, Geir Kjetil AND Nekrutenko. 2013. “Ten Simple Rules for Reproducible Computational Research.” PLoS Comput Biol 9 (10). Public Library of Science: e1003285. https://doi.org/10.1371/journal.pcbi.1003285.
Schulte, Eric, Dan Davison, Thomas Dye, and Carsten Dominik. 2012. “A Multi-Language Computing Environment for Literate Programming and Reproducible Research.” Journal of Statistical Software 46 (1): 1–24. https://doi.org/10.18637/jss.v046.i03.
Steen, Arturo AND Fang, R. Grant AND Casadevall. 2013. “Why Has the Number of Scientific Retractions Increased?” PLoS ONE 8 (7). Public Library of Science: e68397. https://doi.org/10.1371/journal.pone.0068397.
Stodden, Victoria, Friedrich Leisch, and Roger D Peng. 2014. Implementing Reproducible Research. Chapman; Hall/CRC.
Van Noorden, Richard. 2011. “Science Publishing: The Trouble with Retractions.” Nature 478 (9): 26–28. https://doi.org/10.1038/478026a.
Wainer, Howard. 1997. “Improving Tabular Displays, with Naep Tables as Examples and Inspirations.” Journal of Educational and Behavioral Statistics 22 (1): 1–30. https://doi.org/10.3102/10769986022001001.
Wickham, Hadley. 2016. Ggplot2: Elegant Graphics for Data Analysis. Springer.
Wilson, Greg, D. A. Aruliah, C. Titus Brown, Neil P. Chue Hong, Matt Davis, Richard T. Guy, Steven H. D. Haddock, et al. 2014. “Best Practices for Scientific Computing.” PLoS Biol 12 (1).
Xie, Yihui. 2015. Dynamic Documents with R and Knitr. 2nd ed. Boca Raton, Florida: Chapman; Hall/CRC. http://yihui.name/knitr/.
Xie, Yihui. 2016. Bookdown: Authoring Books and Technical Documents with R Markdown. CRC Press.