ps_pca
ps_pca.RdCompute and plot principal components after standardizing the data
Usage
ps_pca(
  doc = "ps_pca",
  data,
  ID = " ",
  GroupVar,
  Groups,
  AnalyticVars,
  ScreePlot = FALSE,
  BoxPlots = FALSE,
  pcPlot = TRUE,
  PlotPoints = TRUE,
  PlotEllipses = TRUE,
  PlotHull = FALSE,
  PlotMedians = FALSE,
  Ellipses = c(0.95, 0.99),
  PlotColors = TRUE,
  legendLoc = "topright",
  Colors = c("red", "black", "blue", "green", "purple"),
  Identify = FALSE,
  digits = 3,
  Seed = 11111,
  folder = " "
)
Arguments
- doc
A string with documentation in the list returned, default is the function name
- data
A matrix or data frame containing the data to be analyzed
- ID
An optional name for an ID, default is " " if no ID
- GroupVar
The name for variable defining grouping; a variable name is required
- Groups
Character-valued defining the values of the group variable for which plots are to be done. Options are a vector of values; "All" (use all groups). One of these is required
- AnalyticVars
A vector of names (character values) of analytic results
- ScreePlot
Logical, if TRUE create a scree plot, default is FALSE
- BoxPlots
Logical, if TRUE, create box plots of the first two components, default is FALSE
- pcPlot
Logical, if TRUE (the default), create the plot of the first two components
- PlotPoints
Logical, if TRUE (the default) and pcPlot=TRUE, plot the points for the first two components
- PlotEllipses
Logical, if TRUE (the default), plot the confidence ellipse or ellipses for each group
- PlotHull
Logical, if TRUE, plot the convex hull for each group, default is FALSE
- PlotMedians
Logical, if TRUE, plot the symbol for each group at the median point for that group, default is FALSE
- Ellipses
A value or vector of proportions for confidence ellipses; default is c(.95,.99) to produce 95% and 99% confidence ellipses
- PlotColors
Logical. If TRUE, use list of colors in Colors for points; if F, plot points as black
- legendLoc
Character, location of legend for a plot with points; default is "topright", alternatives are combinations of "top", "bottom", "right", "left"
- Colors
A vector of color names; default is a vector with five names
- Identify
Logical. If TRUE, the user can identify points of interest in plots; information on these points is saved to a file; default is FALSE
- digits
The number of significant digits to return in objects in data frames, default is 3
- Seed
If not NA, the seed for the random number generator used if missing data are imputed; default is 11111
- folder
The path to the folder in which data frames will be saved; default is " "
Value
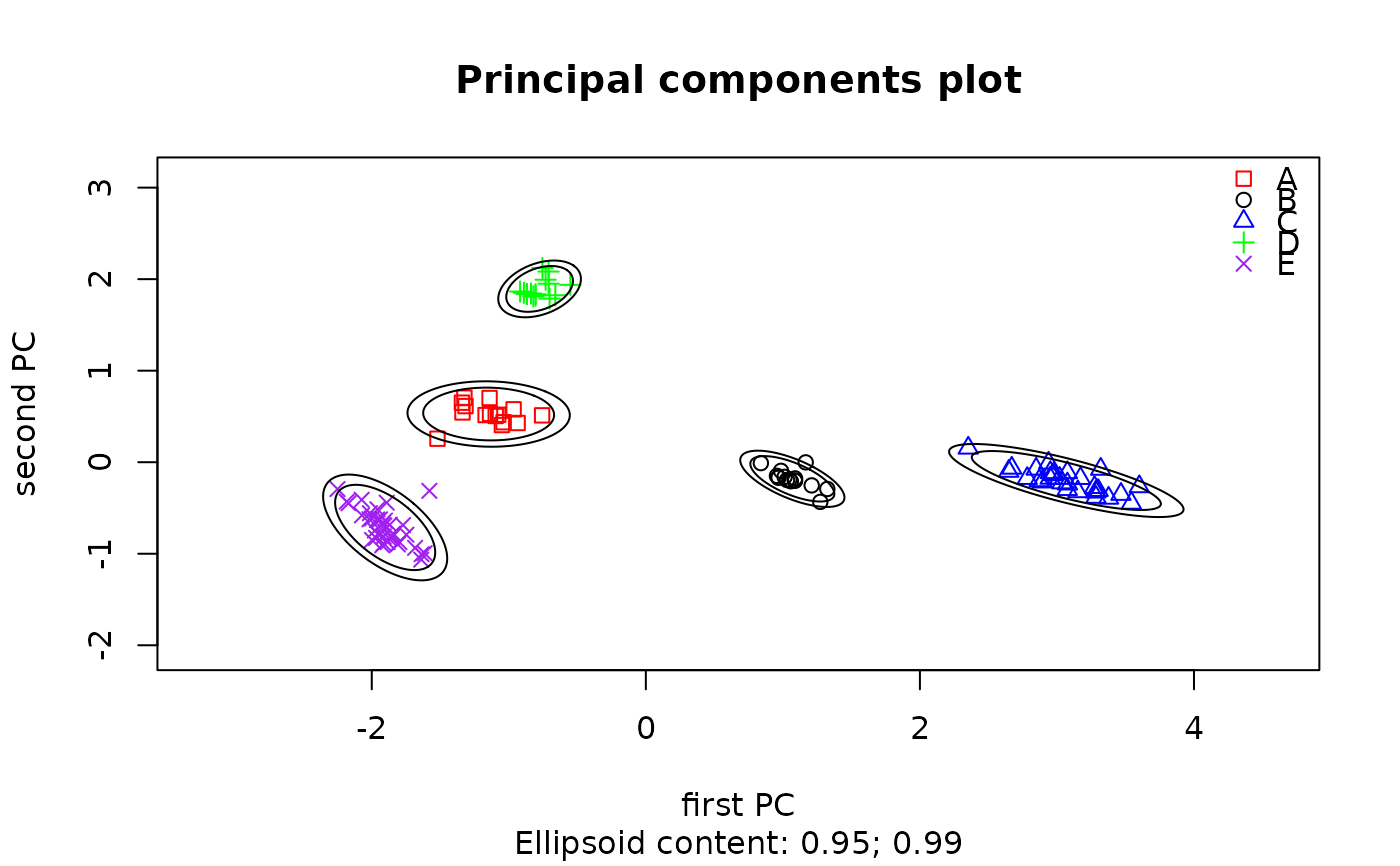
The function produces a plot of the first two principal components, the contents of which are defined by the arguments PlotPoints, PlotEllipses, PlotHull, and PlotMedians. A scree plot and box plots are produced if requested. The function returns a list with the following components:
usage: A string with the contents of the argument doc, the date run, the version of R used
dataUsed: The contents of the argument data restricted to the groups used
dataNA: A data frame with observations containing a least one missing value for an analysis variable, NA if no missing values
params: A list with the values of the arguments for grouping, logical parameters, Ellipses, and Colors
analyticVars: A vector with the value of the argument AnalyticVars
ellipse_pct: The value of the argument Ellipses
variances: A data frame including the percent of variation explained by each principal component and the cumulative percent explained
weights: A data frame with the principal component weights for each observation
Predicted: A data frame with the predicted values for each principal component, plus the value of Groups and an integer GroupIndex (with values 1:number of Groups)
DataPlusPredicted: A data frame with the data used to compute the principal components, plus GroupIndex (as defined above) and predicted values for each principal component
dataCheck: If Identify=TRUE, a data frame with the observations in dataUsed identified as of interest
location: The value of the parameter folder
Details
If Identify=TRUE, the user must interact with each plot (or pane, if there is more than one pane on a plot). To identify a point, place the cursor as close as possible to the point and left click; repeat if desired. To go to the next pane, right click and select "Stop" in base R; click on "Finish" in the plot pane in Rstudio.
