ps_2dPlotGauss
ps_2dPlotGauss.RdPlot and check specified pairs of analysis variables for bivariate normality.
Usage
ps_2dPlotGauss(
  doc = "ps_2dPlotGauss",
  data,
  GroupVar,
  ID,
  Groups,
  AnalyticVars,
  variablePair,
  scatterplot = TRUE,
  QQPlot = TRUE,
  pvalue_digits = 3,
  Identify = FALSE,
  folder = " "
)
Arguments
- doc
A string documenting use written to the output list; default is the function name
- data
A matrix or data frame containing the data to be analyzed
- GroupVar
The name for the variable defining grouping, " " if no grouping
- ID
The name for the variable with a lab ID, " " if no lab ID is used
- Groups
A vector of values of the group variable for which plots are to be done; if "All", use all groups; if " ", no grouping
- AnalyticVars
A vector with the names of all analytic variables of interest
- variablePair
A vector of length 2 with the names of the variables to be shown in the plots
- scatterplot
Logical (default is TRUE): specify whether to show scatter plots when QQPlot = FALSE
- QQPlot
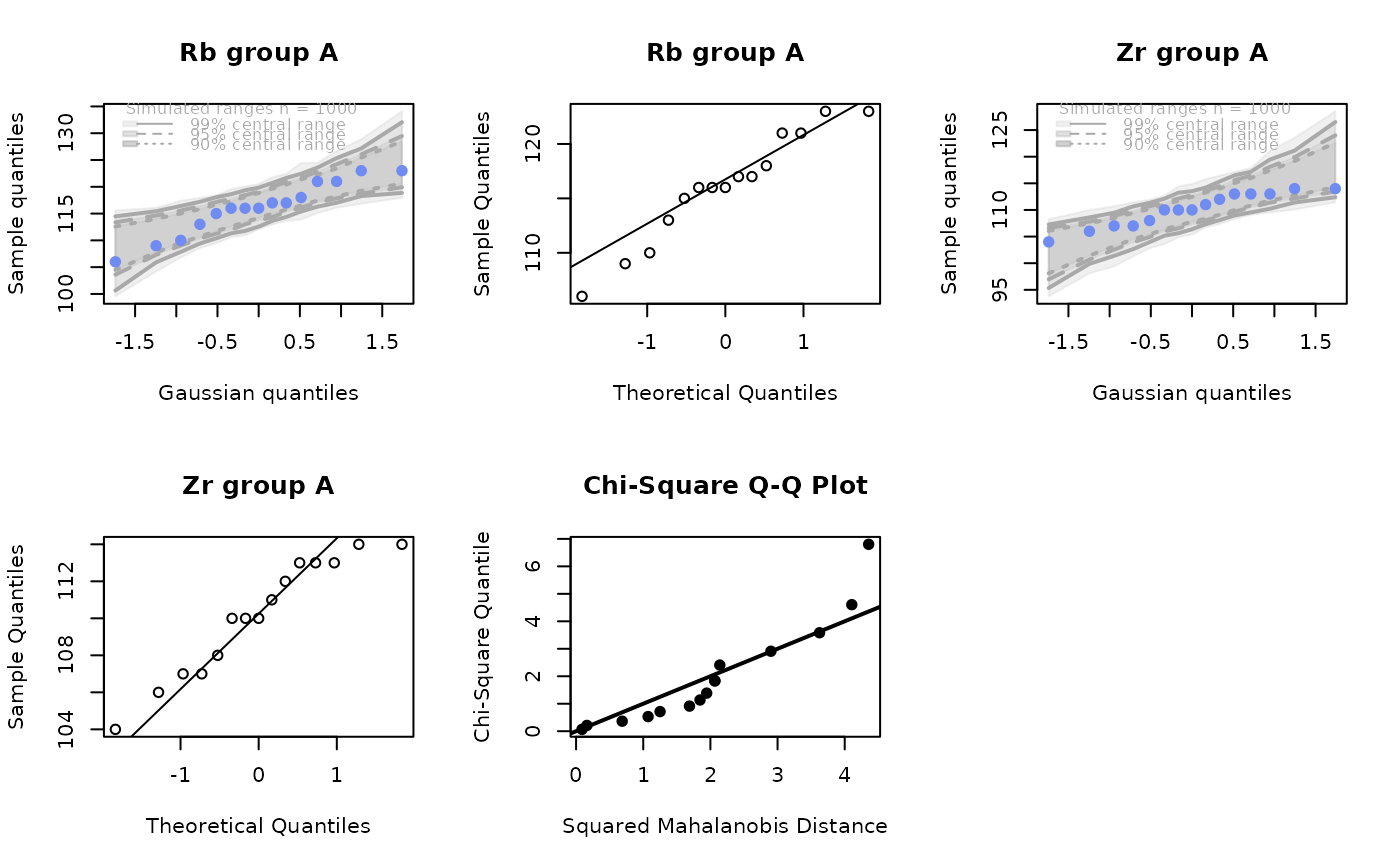
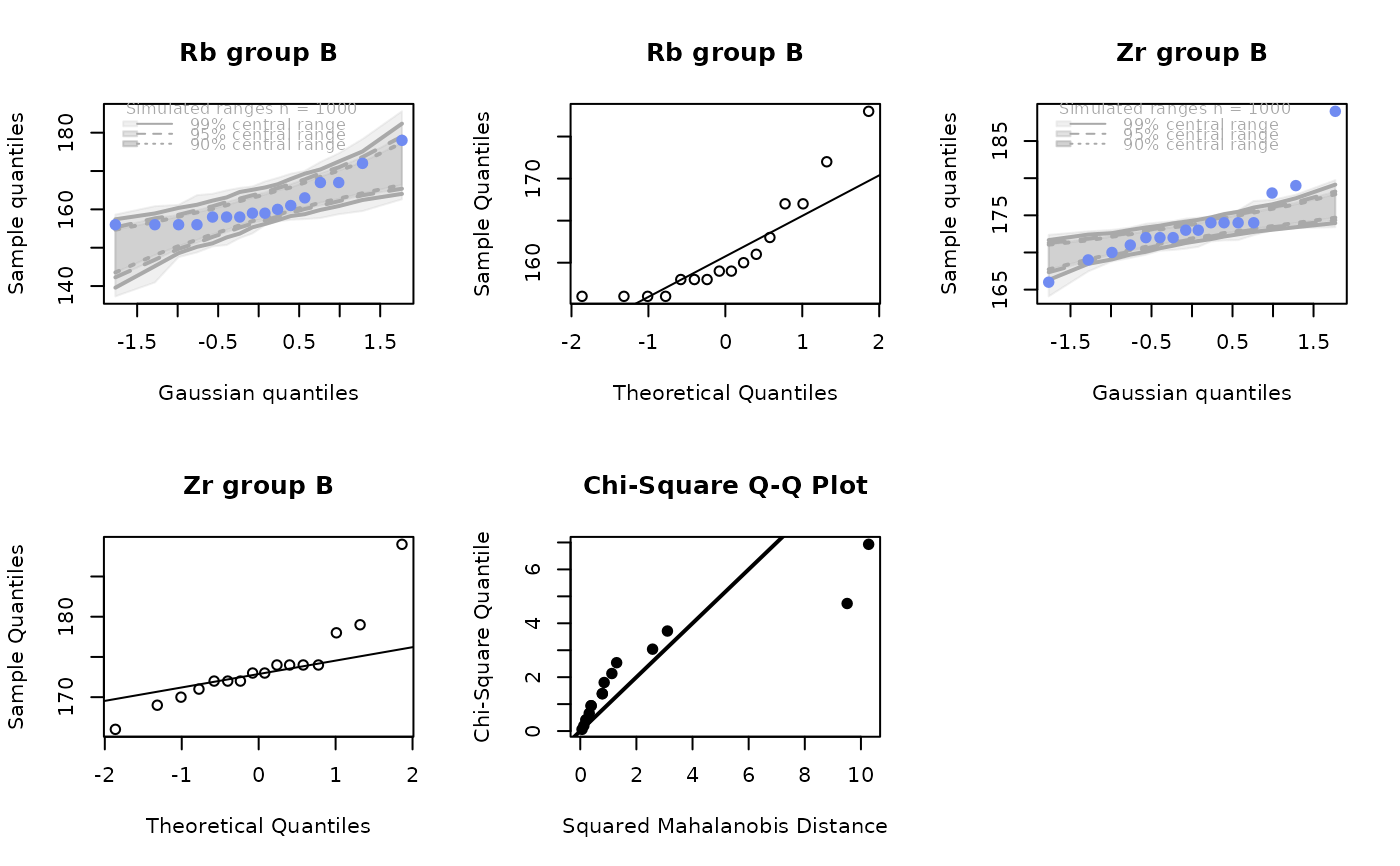
Logical (default is TRUE): specify whether to show the q-q plots with the bootstrap envelopes and multivariate plots
- pvalue_digits
Numeric (default is 3): number of significant digits retained in tests for normality
- Identify
Logical(default is FALSE): if TRUE, user can identify points of interest in the plots
- folder
The path to the folder in which data frames will be saved; default is " "
Value
A list with the following components:
usage: String with the contents of the argument doc, the date run, the version of R used
dataUsed: The contents of the argument data restricted to the groups used
dataNA: A data frame with observations containing a least one missing value for an analysis variable, NA if no missing values
analyticVars: A vector with the contents of the argument analyticVars
variablePair: A vector with the contents of the argument variablePair
params: A list with the values of grouping, logical, and numberic arguments
pvalues: A data frame with the p-values for univariate and bivariate tests of normality
dataCheck: If Identify=TRUE, a data frame with the information on user-identified points of interest
location: The value of the parameter folder
Details
If QQPlot = TRUE, by default each page has panes in two rows and three columns (but there is a new page for successive groups). The function stops after producing each row of each plot. Enter c ("continue") at the prompt to get the next plot. If QQPlot = FALSE, only the standard qq plots are shown, and the function stops after producing each page. See the vignette for more information: visualizing each plot, the information obtained by using the package qqtest, the tests for bivariate normality, and identifying points of interest.